Graph Drawing

NPlot
- Supported Platforms: .NET (WinForms)
- Dimension Support : 2D
- User Control Interface: ?
- Data Binding Support: ?
- Tutorials: 1/5
- User Base: 1/5
- License/Price: Open Source
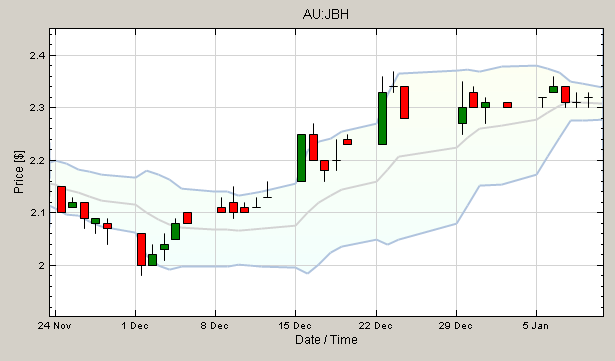
Graphing program that hasn’t had much development recently, but still relatively powerful. Nice interactive scaling/scrolling features of graphs, making it easy to look at lots of data on one chart! Owing to the age and little popularity for this control, tutorials and help are severely limited.
External Link: http://netcontrols.org/nplot/wiki/
OxyPlot
- Supported Platforms: .NET (WPF)
- Dimension Support : 2D
- User Control Interface: ?
- Data Binding Support: 5/5
- Tutorials: 1/5
- User Base: 2/5
- License/Price: Open Source
- NuGet Supported: Yes
External Link: http://oxyplot.codeplex.com/
OxyPlot is a good plotting control when you are using WPF (Windows Presentation Foundation). It uses portable class libraries (PCL), so the same assembly can be used with WinForms, WPF, Silverlight and Windows Store apps. However, this causes a error message to appear in the visual designer when using the PCL library in a WPF application created with Visual Studio 2012. It still compiles/runs fine, it just prevents the graph from being seen visually at design time. This error is discussed extensively here, and a workaround package OxyPlot.Wpf_NoPCL created.
Smoothing The Lines
OxyPlot has the ability to smooth out plot lines automatically, which can be enabled with the following code.
LineSeries ls = new LineSeries();
// Automatically smooth pointsls.smooth = true;
RadChart
- Supported Platforms: .NET (WinForms, WPF)
- Dimension Support : 2D
- User Control Interface:
- Data Binding Support: Database, XML, DataSet, List, Array
- Tutorials: 5/5
- User Base: 4/5
- License/Price: Yearly License Fee
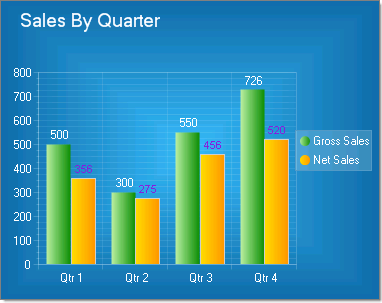
Although slightly expensive, this is awesome graph/charting software (and not limited to just graphs either).
External Link: http://www.telerik.com/products/winforms.aspx
Some QuickStart RadChart Examples
private void DrawInstantaneousGraph(RadChart radChart) {    radChart.ChartTitle.TextBlock.Text = "Instantanious CDC Values";
    // Set-up bar chart    radChart.Series.Clear();
    // Y-Axis Setup    radChart.PlotArea.YAxis.AutoScale = false;    radChart.PlotArea.YAxis.Step = 1000;    radChart.PlotArea.YAxis.MaxValue = 41000;    radChart.PlotArea.YAxis.MinValue = 31000;
    radChart.PlotArea.YAxis.Appearance.MajorGridLines.Width = 5000;    radChart.PlotArea.YAxis.Appearance.MajorGridLines.Visible = false;    radChart.PlotArea.YAxis.Appearance.MinorGridLines.Width = 1000;    radChart.PlotArea.YAxis.Appearance.MinorGridLines.Visible = false;    radChart.PlotArea.YAxis.AxisLabel.Visible = false;
    ChartSeries chartSeries = new ChartSeries();
    chartSeries.Type = ChartSeriesType.Bar;
    // Get the last datarow from the dataTable    DataRow dataRow0 = serialStreamDecoder1.dataTable1.Rows.Find(serialStreamDecoder1.dataTable1.Rows.Count - 1);
    for (int i = 0; i < dataNames.Count(); i++) {        ChartSeriesItem chartSeriesItem = new ChartSeriesItem();        // Increment x to spread bars across the graph (otherwise they will be        // piled ontop of one-another)        chartSeriesItem.XValue = i;        // Assign dataIList from table        chartSeriesItem.YValue = dataRow0.Field<int>(dataNames[i]);        // Assign name to bar on graph        chartSeriesItem.Name = dataNames[i];        chartSeries.AddItem(chartSeriesItem);    }
    // Add the collection of data points to the graph    radChart.AddChartSeries(chartSeries);
    radChart.Refresh();}
ZedGraph
- Supported Platforms: .NET (Windows Forms)
- Dimension Support : 2D
- User Control Interface: Yes (zoom, scale, save to image)
- Data Binding Support: Arrays
- Tutorials: 3/5
- User Base: 4/5
- Licnese/Price: Free/Open Source
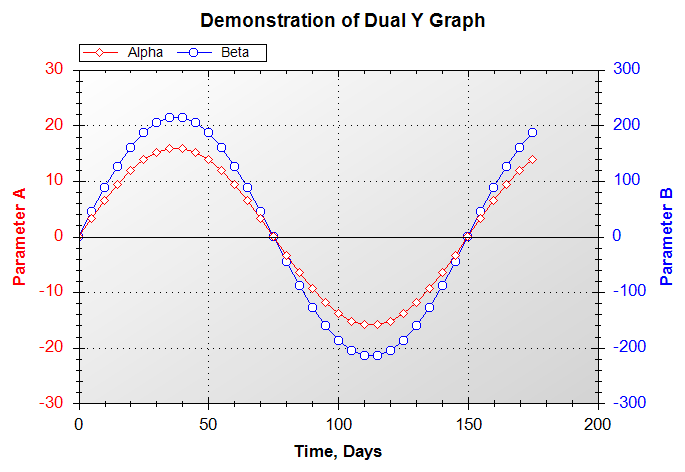
Probably the most powerful and easy-to-use free graphing utility out there if you just want to draw 2D graphs. Fast drawing and not system resource intensive. Supports only Windows Forms, and not WPF. However, you can still use ZedGraph in a WPF application by embedding the ZedGraph in a WindowsFormsHost object in the WPF project. See here for detailed instructions.
External Link: http://sourceforge.net/projects/zedgraph/
Some QuickStart ZedGraph Examples
private void DrawInstantaneousGraph(ZedGraph.ZedGraphControl zedGraph, DataRow dataRow, graphRows graphRow) {    zedGraph.GraphPane.Title.Text = "Instantaneous CDC Values";
    // Set-up bar chart    zedGraph.GraphPane.CurveList.Clear();
    // Determine which columns to display (the columns for row1, row2, or both)
    int startCol = 0;    int stopCol = 0;
    if (graphRow == graphRows.row1)    {        startCol = 1;        stopCol = 6;    }    else if (graphRow == graphRows.row2)    {        startCol = 7;        stopCol = 12;    }    else if (graphRow == graphRows.both)    {        startCol = 1;        stopCol = 12;    }
    ZedGraph.PointPairList pointPairList = new ZedGraph.PointPairList();
    for (int i = startCol; i <= stopCol; i++)    {        ZedGraph.PointPair pointPair = new ZedGraph.PointPair();        // Increment x to spread bars across the graph (otherwise they will be        // piled ontop of one-another)        pointPair.X = i;        // Assign dataIList from table        pointPair.Y = dataRow.Field<int>(dataNames[i-1]);        // Assign name to bar on graph        //chartSeriesItem.Name = dataNames[i];        pointPairList.Add(pointPair);    }
    ZedGraph.LineItem lineItem = zedGraph.GraphPane.AddCurve("Test", pointPairList, Color.White);
    zedGraph.AxisChange();
    GraphFunc.SetBasicGraphColours(zedGraph, Color.Black, Color.White);
    zedGraph.Invalidate();
}