A Tutorial On geopandas

geopandas is a Python library that adds extra functionality to pandas to make it more useful for dealing with geospatial data.
Most of the code examples below assume you have imported geopandas into the current module with:
import geopandasPlotting
geopandas makes it very easy to plot geospatial data onto graphs.
world = geopandas.read_file(geopandas.datasets.get_path('naturalearth_lowres'))world.plot(figsize=(10,10))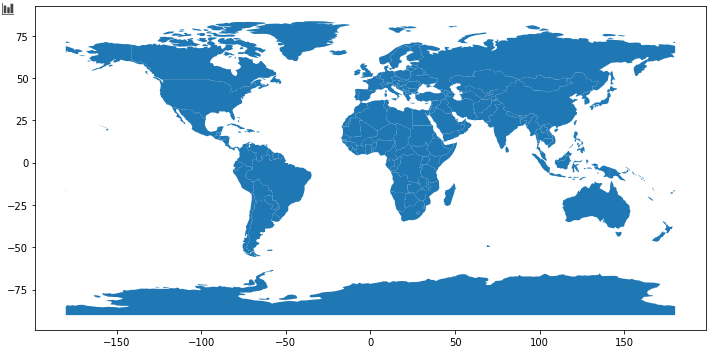
If you want to save the plot, you can import matplotlib.pyplot and use the standard save_fig() function:
import matplotlib.pyplot as pltplt.save_fig('plot.png')Common Warnings/Errors
Missing package rtree
/usr/local/lib/python3.7/site-packages/geopandas/base.py:116: UserWarning: Cannot generate spatial index: Missing package `rtree`.You are missing the package rtree. rtree can not usually easily be installed with pip alone because it depends on a number of dependencies that pip does not manage. It is best to use your systems package manager to install rtree instead.
No module named descartes
ModuleNotFoundError: No module named 'descartes'Running pip install geopandas does not install the dependency descartes automatically. descartes is needed when plotting, for example when you call .plot(). Install with:
pip install descartes