valgrind

Valgrind is a tool that can be used to detect memory management and threading bugs.
Installation
-
Download the latest Valgrind source code from http://valgrind.org/downloads/. For example, this downloads version 3.12.0:
Terminal window ~$ wget http://valgrind.org/downloads/valgrind-3.12.0.tar.bz2 -
Unpack the tarball with tar:
Terminal window ~$ tar -jxvf valgrind-3.12.0.tar.bz2 -
cd into the root directory of the unpacked source code.
Terminal window ~$ cd valgrind-3.12.0 -
Run configure with
Terminal window ~/valgrind-3.12.0$ /configure -
Run make with:
Terminal window ~/valgrind-3.12.0$ make -
Install valgrind onto your system with:
Terminal window ~/valgrind-3.12.0$ sudo make install -
Done! You should now be able to run valgrind by typing:
Terminal window ~/valgrindfrom any directory in your shell.
Profiling With Valgrind
The most simple way to run a program with Valgrind is to call valgrind and pass in the executable at the only parameter:
~$ valgrind ./profiling_testThis will run Memcheck, a memory error detector. Expect your program to run 4-10x slower!
To run callgrind, use the following command:
~$ valgrind --tool=callgrind ./profiling_testThe order of the optional parameters to valgrind is important! Make sure --tool=callgrind comes BEFORE the path to your executable.
This will generate a profile data file called callgrind.out.<pid> in the same folder as the exectuable. To display the results of the profiling:
~$ callgrind_annotate callgrind.out.<pid>--dump-instr=yes allows you to get profile information at the instruction level.
However, this text can be hard to analyze! Thankfully, there is a visual tool called kcachegrind which can create visual graphs from the callgrind output (yes, kCACHEgrind can display the results of CALLgrind). kcachegrind can be installed on Ubuntu with:
$ sudo apt install kcachegrindBe warned, kcachegrind could require around 350MB of space! I recommend you install kcachegrind on your development machine rather than embedded Linux.
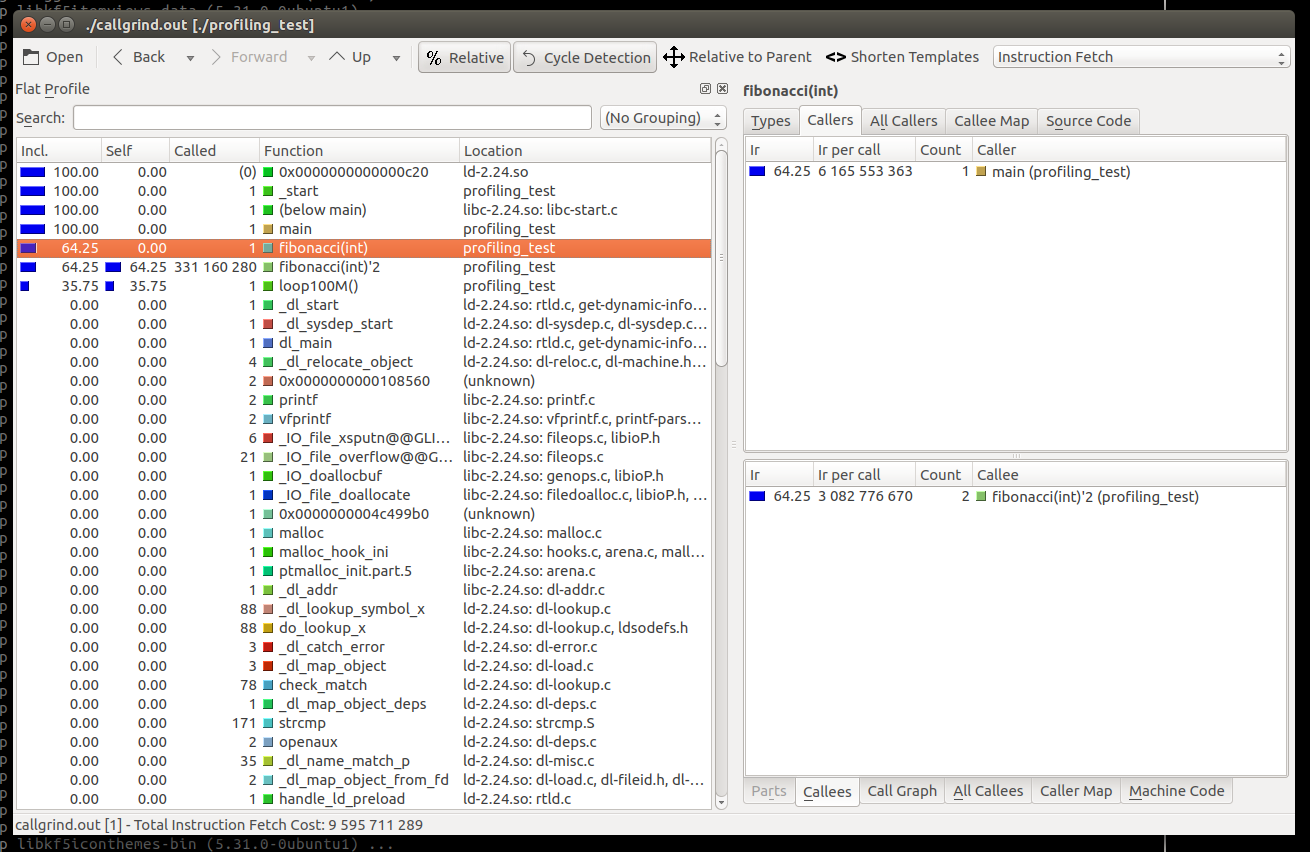
kcachegrind can then be started by calling kcachegrind in the same directory as the cachegrind output data file:
$ kcachegrindYou should then be presented with wonderful profiling data as shown below!