How To Create Sine Waves From Square Waves And RC Filters

During circuit design, you may need a sine wave for some reason. One way to create a sine wave is by generating a square wave (which is trivial to produce digitally) and then filtering the result with some RC filters.
If you can remember Fourier analysis, a square wave can be thought of as being made up of an infinite number of sine waves, starting at the fundamental frequency and then going up with all the odd numbered harmonics. The filtering works by allowing the fundamental frequency through (it’s in its pass band), whilst blocking all the higher harmonics. The image below shows a , square wave and its FFT. You can see the spike which represents the fundamental at . The next spike is the 3rd harmonic at .

One RC filter does not provide enough attenuation of the higher harmonics. But we can stack many RC filters together until we get a sine wave which is “good enough”. One disadvantage of the RC filter approach is that the voltage gets attenuated through every stage of the filter. If this is going to be a problem, active filters can be used (or an amplifier could be added at the end).
Choosing The R And Cs
Let’s say we want a sine wave at . We’ll configure a timer or PWM peripheral on a microcontroller to output a square wave at with a duty cycle.
For each RC filter, we get to pick either the capacitance or resistance and then calculate the other. Let’s pick a capacitance of .
We’ll design the cut-off frequency of each stage to be equal to the desired sine wave frequency. Remember that the cut-off frequency for an RC filter is:
where:
is the cut off frequency ( point) in Hertz []
is the resistance in Ohms []
is the capacitance in Farads []
This means the resistor in each RC stage has to be:
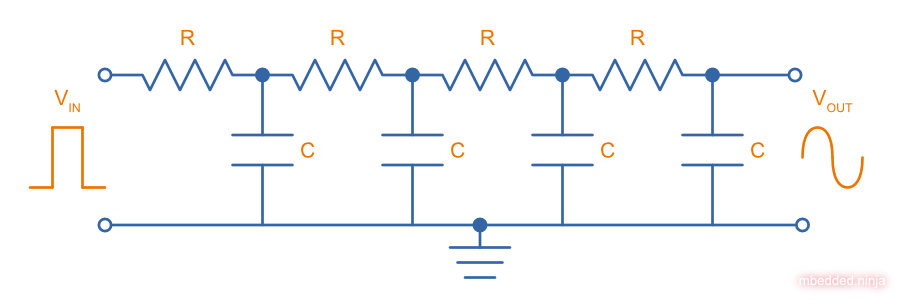
Remember, all the and values should be the same. This gives us the following schematic:
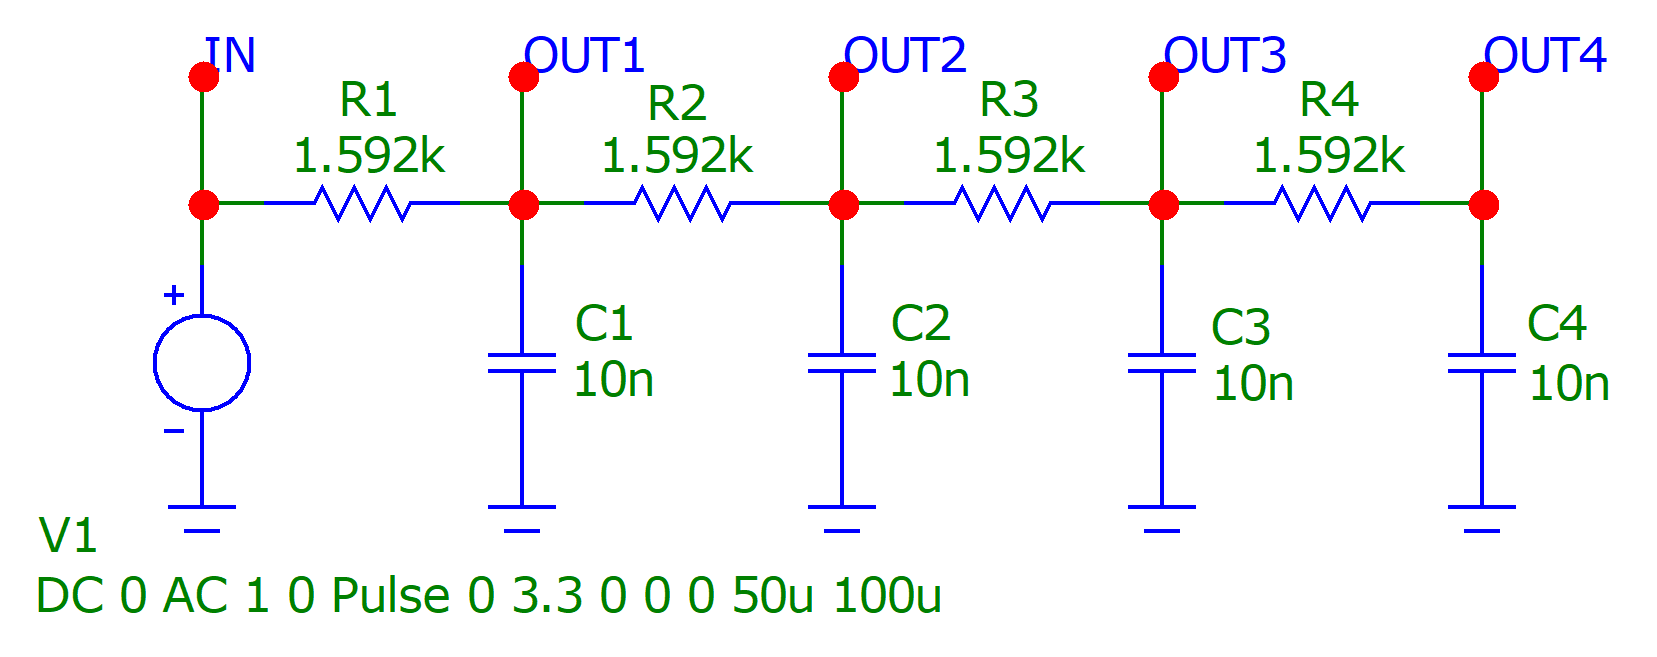
I added taps at the outputs of the intermediate stages so we can see how the waveform changes as it moves through the circuit!
Simulating The Sine Wave Generator
The simulated output voltage waveforms are shown below (using SPICE transient analysis). Note how the waveforms get progressively more and more sinewave-esque as they pass through each RC filter stage:

It’s also interesting to point out that the final output the sine wave has a DC offset of . This is because the DC component (average voltage) of the input square wave at duty cycle is . If you want to remove this bias, you can connect an AC coupling capacitor to the output to center the sine wave around .
The bode plots (frequency response) of this circuit are shown below. Each successive filter stage increases the slope of the attenuation. At the fundamental frequency (which is the frequency we want to pass) of , the attenuation is (14x reduction). At (which is the 3rd harmonic of the square wave, and we want to block this), the output is attenuated by (178x reduction).

Distortion
Is a four stage RC filter going to produce a perfect sine wave? No. It just happens that four stages produces a sine wave which is “good enough” for most applications. We can do an FFT on the resulting output to see how “good” our sine wave is. A pure sine wave will have a single spike in the FFT at the fundamental frequency. Any distortion will show up as other spikes in the FFT. And while we are at it, let’s do an FFT of the output from each intermediate stage, to see how the quality improves as it makes its way through the circuit.
The following plots show the waveform and its FFT at the input and at the output of each RC filter stage. The DC component of the waveform has been removed so as not to swamp the FFT plot (we usually don’t care about the DC component anyway, we could easily remove this with an AC coupling capacitor).

One figure of merit we can use for each output is the total harmonic distortion (THD). This is found by taking the square root of the sum of the squares of the RMS harmonic magnitudes in the FFT plots, and dividing it by the RMS voltage of the fundamental frequency. If we do this, we get the following graph:

By the time we get to the final output, , we are down to a THD of . Pretty good!
Other Methods Of Making A Sine Wave
Using cascaded RC filters is only one way of many to create sine waves! Some other popular methods include:
-
Using a switched-capacitor IC: This is essentially the same method as using cascaded RC filters except by using a switched-capacitor filter IC you can get higher order filters with a smaller number of components (e.g. an 8th order filter is not unusual).
-
A digital-to-analogue converter (DAC): You can easily generate a sine wave by feeding it with sine wave digital codes generated in a microcontroller or FPGA. Precision will depend on the resolution and clock speed of the DAC.
-
A Wien Bridge Oscillator: Using an op-amp, 2x diodes and a few resistors/capacitors you can generate very pure sine wave.
-
Function generator: The simple go-to method to create a sine wave in a laboratory environment. Very flexible in terms of the frequency and amplitude you can choose.