Memfault

Memfault is a commercial cloud-based service designed for managing and analysing faults/data from a fleet of internet-connected embedded devices. It also allows you to manage and deploy OTA (over-the-air) updates to your devices.
Dashboard
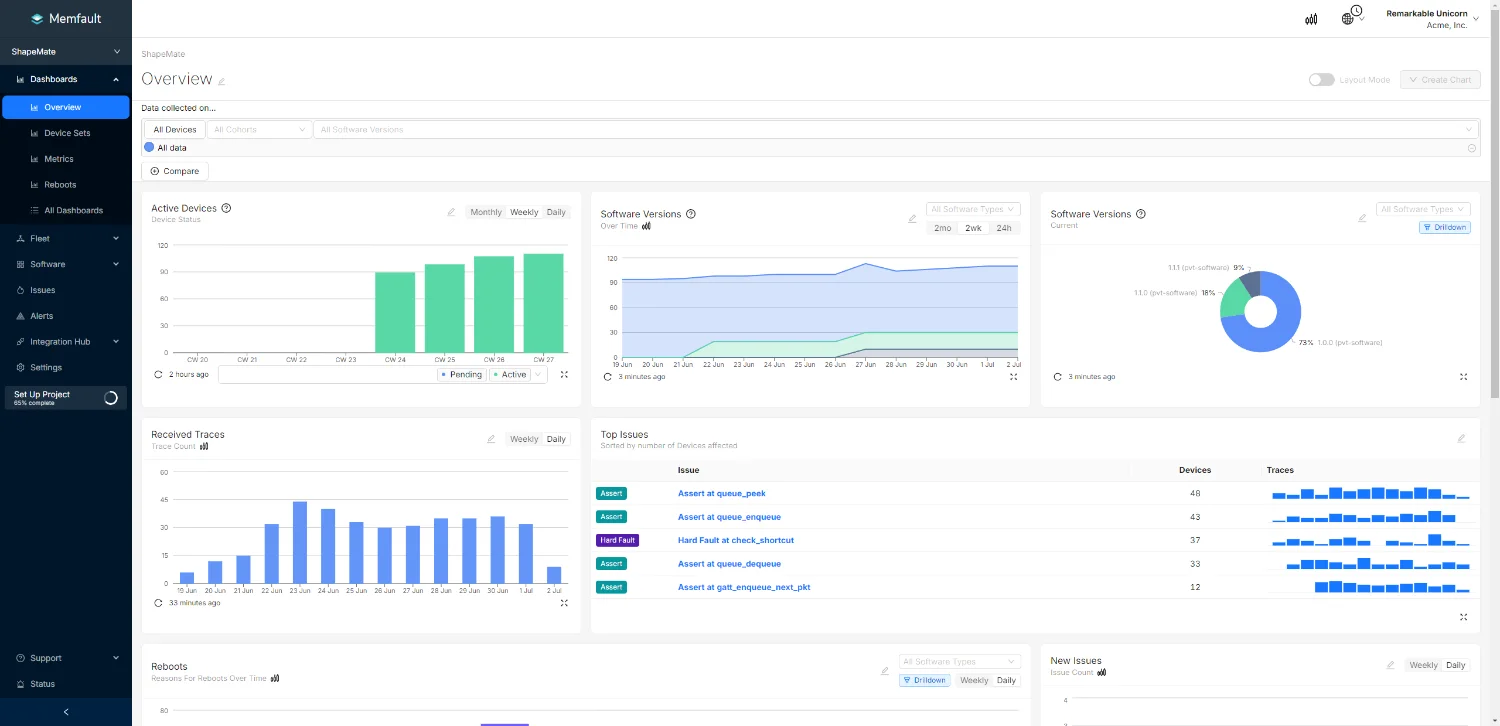
Memfault has a web-based dashboard for viewing data from your devices and managing things like OTA updates.
Heartbeats
Heartbeats are one of the common ways of sending data from your embedded device to Memfault. Not only do they indicate to Memfault that your device is still alive, but heartbeats can also contain user-defined metrics that you can use to monitor things like battery life, temperature, and more.
As of June 2024, all Memfault pricing plans allow up to 24 heartbeats per day3.
Heartbeats can be triggered manually with memfault_metrics_heartbeat_debug_trigger().
Metrics
Metrics are parameters you can track on your embedded device. The data is cached locally and sent to Memfault on the next heartbeat.
Metrics are defined with MEMFAULT_METRICS_KEY_DEFINE() macro in your memfault_metrics_heartbeat_config.def file4.
The macro takes two parameters, the name of the metric and it’s type. For example:
MEMFAULT_METRICS_KEY_DEFINE(my_metric, kMemfaultMetricType_Unsigned);Then, in your code, you can set/update the metric with MEMFAULT_METRIC_SET_xxx() or MEMFAULT_METRIC_ADD() marcos:
#include "memfault/metrics/metrics.h"
void main() {    // ...    MEMFAULT_METRIC_SET_UNSIGNED(my_metric, 1234); // Directly set the metric to 1234    MEMFAULT_METRIC_ADD(my_metric, 1); // Increment the metric by 1    // ...}
The following metric types are supported4:
kMemfaultMetricType_SignedkMemfaultMetricType_UnsignedkMemfaultMetricType_TimerkMemfaultMetricType_String
You can either manually define metrics via the Memfault web dashboard or by uploading the built .elf file. You need to make sure you define your metrics, otherwise you won’t see them come through, as Memfault will ignore any unrecognized metrics that are posted to it’s API.
Memfault imposes quotas on the amount of different metrics you can have per project.
More about metrics can be read in the Memfault Docs here.
Traces
Memfault gives you the ability to send traces from your embedded device. A trace is designed to be sent when a significant issue occurs. By defaults, traces send you emails.
A popular type of trace is a “core dump” trace. This is a comprehensive trace that can contain stack traces for every thread, the state of the CPU registers, and the values of static variables. Core dumps traces require the .elf file of the application to be uploaded to Memfault. Each .elf file is associated with a specific version of the firmware.
nRF Memfault Phone App
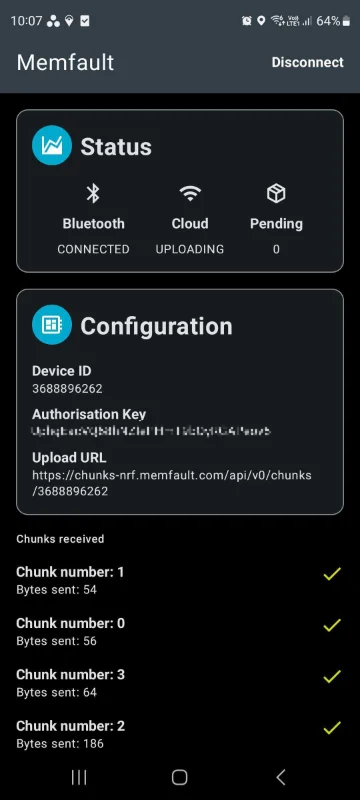
The nRF Memfault app by Nordic Semiconductor is a phone app (available for Android and iOS) which allows you to connect to devices running Memfault and publishing on the Memfault Diagnostic Service (MDS). The MDS is a Bluetooth GATT service. The app connects to these devices and streams the “chunks” from the device to the Memfault cloud.
The nRF Memfault app displays the application key (project key) and device ID.
Memfault CLI
Memfault CLI is a Python tool for interacting with the Memfault Cloud API via the command line. It is useful for automating tasks (as an alternative to using the manual web GUI) such as uploading firmware, symbol files, and more from your CI/CD pipeline.
Installation
The Memfault CLI is on PyPI can be installed using pip with the command:
pip3 install memfault-cliIt is recommended to install the CLI in a virtual environment to avoid conflicts with other Python packages.
Using Memfault with Zephyr
Memfault has first-class support for the Zephyr RTOS.
Kconfig Options
CONFIG_MEMFAULT_COREDUMP_COLLECT_BSS_REGIONS: Set toyto collect the BSS region (0 initialised data) of the application as part of the core dump. Defaults ton.CONFIG_MEMFAULT_COREDUMP_MAX_TRACKED_TASKS: The maximum number of tasks that are tracked in the core dump. For each task, the task name, back trace (up to a limit) and task run state (e.g.RUNNING,SUSPENDED) are collected. Defaults to32.CONFIG_MEMFAULT_LOGGING_ENABLE: Set toyto route Zephyr log messages to the Memfault log system (i.e. install the Memfault logging backend into Zephyr). Defaults ton.CONFIG_MEMFAULT_RAM_BACKED_COREDUMP_SIZE: The amount of RAM to use for storing core dumps. Defaults to8192bytes.
A complete list of the Memfault Kconfig options can be found here.
Logging
Memfault supports sending log messages to the Memfault cloud. This is useful for debugging issues with your device.
Unfortunately, communication from Zephyr to Memfault logging will not occur if the log mode is set to immediate (CONFIG_LOG_MODE_IMMEDIATE=y). This logic is found in memfault-firmware-sdk/ports/zephyr/common/memfault_logging.c. This is because when in immediate mode, logging can occurs from ISRs and this might corrupt the Memfault logging buffer.
Assert’s won’t be captured by Memfault automatically if you have routed Zephyr logging to Memfault, because assert prints using printk() rather than LOG_ERR(). One way to fix this is to enable printk to log forwarding by adding.
If you can’t forward printk to Zephyr’s logs for some reason (I couldn’t in a particular project because doing so broke AT command mode), then you don’t really have a nice way to capture asserts. Zephyr defines a weakly linked assert_post_action() function that you can override, but unfortunately this only gets passed the file name and line number --- the assert expression and optional message are not provided. These last two parameters are very useful for helping diagnose exactly what went wrong (especially the message, as you can format the value that failed the assert into this). One method I used was to modify the Zephyr source code, which is not ideal since it makes upgrading Zephyr more difficult in the future. I modified zephyr/include/zephyr/sys/__assert.h to change the definition of __ASSERT_PRINT() if CONFIG_SEND_ASSERT_INFO_TO_MEMFAULT_LOG is defined (which I added to the project’s Kconfig file). If it is defined, then __ASSERT_PRINT() calls MEMFAULT_LOG_SAVE() as well as assert_print().
#if defined(CONFIG_ASSERT_VERBOSE)// UPDATE to the Zephyr source code to allow for sending assert information to Memfault logs saved with traces.// Ideally there would be a better way to do this without having to modify the Zephyr source code.// Can't turn on CONFIG_LOG_PRINTK=y because that stopped AT command mode from working in a particular project.#ifdef CONFIG_SEND_ASSERT_INFO_TO_MEMFAULT_LOG#include "memfault/components.h"#define __ASSERT_PRINT(fmt, ...) \ do { \ MEMFAULT_LOG_SAVE(kMemfaultPlatformLogLevel_Error, fmt, ##__VA_ARGS__); \ assert_print(fmt, ##__VA_ARGS__); \ } while (false)#else /* CONFIG_SEND_ASSERT_INFO_TO_MEMFAULT_LOG */#define __ASSERT_PRINT(fmt, ...) assert_print(fmt, ##__VA_ARGS__);#endif /* CONFIG_SEND_ASSERT_INFO_TO_MEMFAULT_LOG */#else /* CONFIG_ASSERT_VERBOSE */#define __ASSERT_PRINT(fmt, ...)#endif /* CONFIG_ASSERT_VERBOSE */Memfault Shell Commands
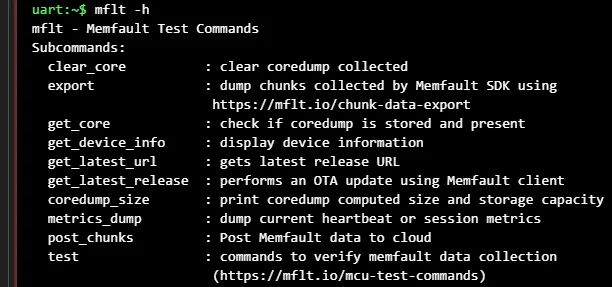
Memfault provides a range of useful Zephyr shell commands that you can enable by setting CONFIG_MEMFAULT_SHELL=y in your prj.conf file. Once enabled, you should see a command called mflt available in the Zephyr shell. The following mflt sub-commands are available:
mflt get_core- Get the core dump from the device (if one exists).mflt test- This contains a number of sub-commands for testing the Memfault integration.
Further Reading
See the Zephyr page for more information on the Zephyr RTOS.
Footnotes
-
Memfault. Memfault Docs. Retrieved 2024-07-03, from https://docs.memfault.com/. ↩
-
Memfault. Demo Dashboard. Retrieved 2024-07-03, from https://demo.memfault.com/organizations/acme-inc/projects/shapemate/dashboards/memfault-overview. ↩
-
Memfault. Pricing Plan. Retrieved 2024-07-04, from https://memfault.com/pricing/#mcu. ↩
-
Memfault. MCU Metrics [documentation]. Retrieved 2024-07-04, from https://docs.memfault.com/docs/mcu/metrics-api. ↩ ↩2