GCC Profiling

To use profiling, the program must be compiled and linked with the -qg profiling option:
We will use an called profiling_test.c (full code can be found at https://github.com/gbmhunter/BlogAssets/tree/master/Programming/ProfilingGprof):
#include <stdio.h>
int fibonacci(int n) {    if(n == 0)        return 0;    else if(n == 1)        return 1;    else        return(fibonacci(n-1) + fibonacci(n-2));}
int loop100M() {    int val = 0;    for(int i = 0; i < 100000000; i++) {    if(i % 10 == 0)        val++;    else if(i % 3)        val--;    }    return val;}
int main (void) {    printf("Fibonacci value = %u\n", fibonacci(40));    printf("Loop value = %u\n", loop100M());
    return 0;}
We will then compile it with the command:
$ gcc -pg profiling_test.c -o profiling_testThis creates what is called an instrumented executable. It contains additional code which records the time spent in each function.
When run, the program will produce a file gmon.out in the same directory as it is run. You can pass your program to gprof to display the profiling results:
$ gprof ./profiling_testFlat profile:
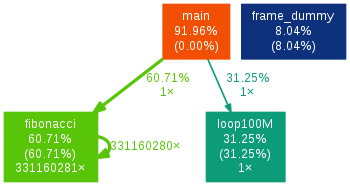
Each sample counts as 0.01 seconds. % cumulative self self total time seconds seconds calls ms/call ms/call name 60.96 0.68 0.68 1 676.63 676.63 fibonacci 31.84 1.03 0.35 1 353.47 353.47 loop100M 8.19 1.12 0.09 frame_dummy...You can see above that approximately 60% of the time was spent calculating the Fibonacci sequence, while 30% was spent looping 100 million times. If this was a real life scenario, you could now start to optimise your code!
If you find text hard to analyze, see the gprof2dot section below on how to create a visualization of the above results.
The above command will write the profiling results to the terminal. Instead, if you wish to write the results to a file, use the following command:
$ gprof profiling_test > profiling_results.txtClean Exiting
gmon.out is only written to if your C/C++ program exits cleanly, that is, it either calls exit() or returns from main().
Here is the relevant info from the gprof manual:
The profiled program must call
"exit"(2)or return normally for the profiling information to be saved in thegmon.outfile.
Your program doesn’t count as a clean exit if it is running in a Linux terminal and Ctrl-C is pressed! However, there is a way to fix this, by catching the Ctrl-C signal and writing to the file before exiting…
#include <dlfcn.h>#include <stdio.h>#include <unistd.h>
void SigIntHandler(int sig) {    fprintf(stderr, "Exiting on SIGUSR1\n");    void (*_mcleanup)(void);    _mcleanup = (void (*)(void)) dlsym(RTLD_DEFAULT, "_mcleanup");    if (_mcleanup == NULL)        fprintf(stderr, "Unable to find gprof exit hook\n");    else _mcleanup();    _exit(0);}
int main() {    signal(SIGINT, SigIntHandler);
... code that does not return here}gprof2dot
gprof2dot is a tool that can create a visualization of the gprof output. TO install gprof2dot:
$ pip install gprof2dotTo install graphviz (which is needed if you are going to make “dot” graphs like below):
$ sudo apt install graphvizTo create a dot graph image:
$ gprof2dot ./profiling.txt | dot -Tpng -o profiling.pngThis created the below image for the example code above: