valgrind
| Date Published: | |
| Last Modified: |
Overview
Valgrind is a tool that can be used to detect memory management and threading bugs.
Installation
Download the latest Valgrind source code from http://valgrind.org/downloads/. For example, this downloads version 3.12.0:
1~$ wget http://valgrind.org/downloads/valgrind-3.12.0.tar.bz2Unpack the tarball with tar:
1~$ tar -jxvf valgrind-3.12.0.tar.bz2cd into the root directory of the unpacked source code.
1~$ cd valgrind-3.12.0Run configure with
1~/valgrind-3.12.0$ /configureRun make with:
1~/valgrind-3.12.0$ makeInstall valgrind onto your system with:
1~/valgrind-3.12.0$ sudo make installDone! You should now be able to run valgrind by typing:
1~/valgrindfrom any directory in your shell.
Profiling With Valgrind
The most simple way to run a program with Valgrind is to call valgrind and pass in the executable at the only parameter:
| |
This will run Memcheck, a memory error detector. Expect your program to run 4-10x slower!
To run callgrind, use the following command:
| |
The order of the optional parameters to valgrind is important! Make sure --tool=callgrind comes BEFORE the path to your executable.
Again, callgrind will make your program run 4-10x slower than usual. If this slow down is unacceptable for whatever reason, but you still want to profile your application, you may want to check out GCC’s gprof which in my experience, causes much less of a performance drop.
This will generate a profile data file called callgrind.out.<pid> in the same folder as the exectuable. To display the results of the profiling:
| |
--dump-instr=yes allows you to get profile information at the instruction level.
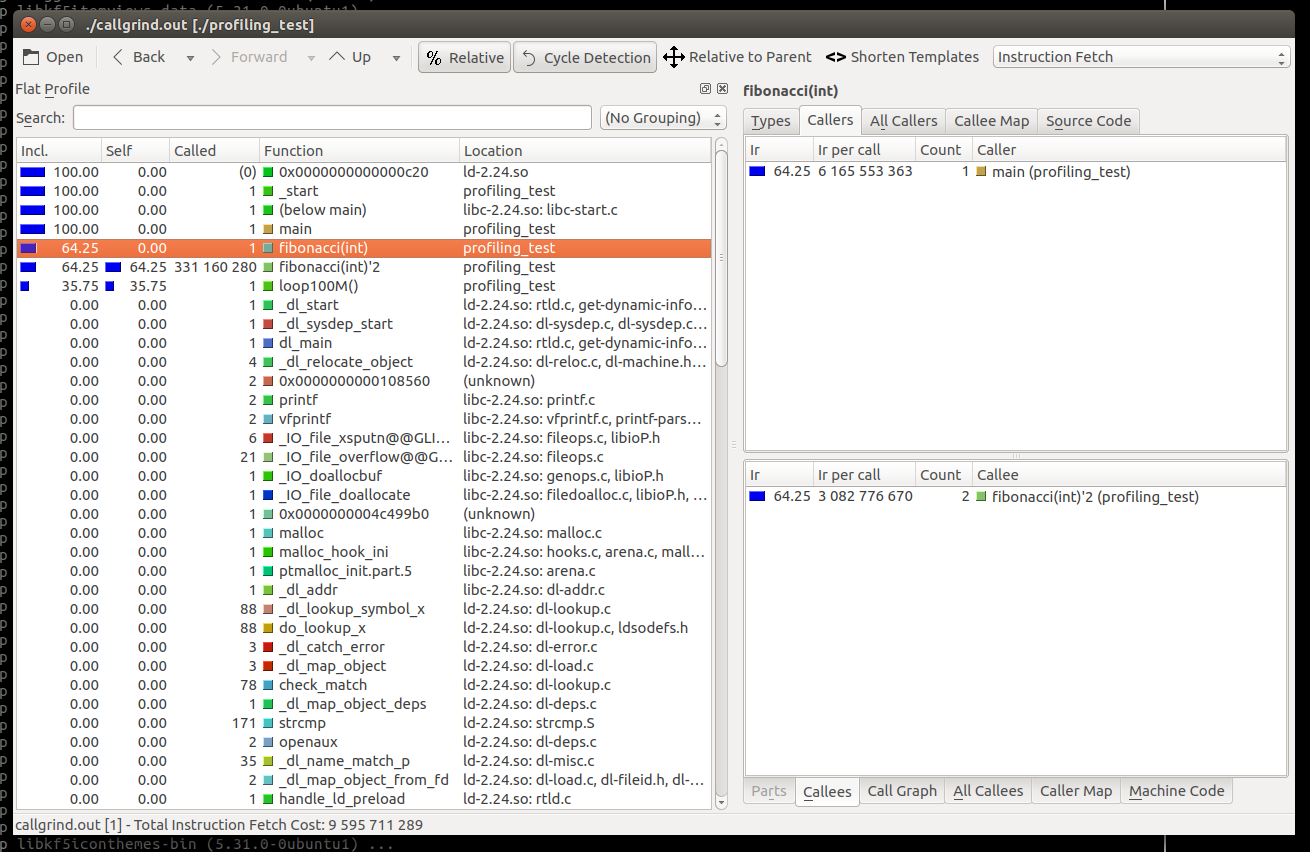
However, this text can be hard to analyze! Thankfully, there is a visual tool called kcachegrind which can create visual graphs from the callgrind output (yes, kCACHEgrind can display the results of CALLgrind). kcachegrind can be installed on Ubuntu with:
| |
Be warned, kcachegrind could require around 350MB of space! I recommend you install kcachegrind on your development machine rather than embedded Linux.
kcachegrind can then be started by calling kcachegrind in the same directory as the cachegrind output data file:
| |
You should then be presented with wonderful profiling data as shown below!
Authors


This work is licensed under a Creative Commons Attribution 4.0 International License .