Altium Simulation
| Date Published: | |
| Last Modified: |
Overview
Note that this page is about the specifics of using Altium Designer for circuit simulation (which uses SPICE). For more detailed information about SPICE, including the various components and parameters it supports, see the SPICE Simulation page.
Altium has a built-in mixed-signal (analogue and digital) simulator. It uses an enhanced version of the event-driven XSPICE, and is fully compatible with SPICE3f5.
Simulating circuits in Altium can be a little confusing, so I’ve written this little guide to help anybody attempting it!
This has been written for Altium Designer Summer 08, but steps should be similar if not identical for other versions of Altium also (it still seems applicable for AD14.3 in July 2014).
Voltage/Current Sources
A pulsed voltage source has the following important parameters:
| Parameter Name | Units | Description |
|---|---|---|
| AC Magnitude | V | |
| Period | s | The period of the pulsed waveform. This should be equal or larger than the pulse width. |
| Pulse Width | s | This should be equal to or less than the period. |
| Rise Time | s | The time it takes the signal to go from 0% to 100%. Related to fall time. |
Simulation Models
There are two types of file extensions that Altium accepts, .mdl and .ckt. MDL files (model files) are used for basic circuit simulation, and CKT files (subcircuit file) are for more advanced components that are built from many primary spice circuit elements (e.g. op-amps).
Altium simulation files are located at C:\Users\Public\Documents\Altium\AD14\Library\Simulation (for Altium Designer 14, path may vary for other versions). These files include basic items you will need while doing simulations, including math functions, simulation voltage and current sources, transmission lines and PSPICE functions.
Vault-Based Simulation Components
You are allowed to use hyphens in the .mdl and .ckt files if using vault-based simulation components.
Simulation models are linked to vault-based components in Component Library files (.CmpLib), .ckt files in the same manner as schematic symbols and PCB footprints. I should point out here that .mdl and .ckt files cannot be used directly, you first have to create a .SimModel file, push it to the vault, and then link that to the component (just like you have to for schematic symbols and PCB footprints).
SimModel Files
The “Model Name” parameter in a SimModel file has to be the same as the model name in the .mdl or .ckt file.
Component Value Multipliers
The Altium simulator supports the following value prefix multipliers. Note the non-standard K for 10e3 and the Meg for 10e6 (the prefixes are case insensitive so M would actually give you 10e-3)! Also note the use of mil, which can be used to describe millionth’s of an inch.
| Suffix | Multiplier |
|---|---|
| f | 10-15 |
| p | 10-12 |
| n | 10-9 |
| u | 10-6 |
| mil | 25.4-6 |
| m | 10-3 |
| K | 103 |
| Meg | 106 |
| G | 109 |
| T | 1012 |
Exponential notation is also supported, so you can write 1000 like this 1e3.
MOSFET Model
The Altium SPICE model for a MOSFET contains the following level-1 parameters (sorted alphabetically):
| Symbol | Parameter | Description |
|---|---|---|
| AD | Drain Area | Area of the drain diffusion (m2). |
| Drain Perimeter | Perimeter of the drain junction (m). Default = 0m. | |
| Initial B-S Voltage | Voltage across the bulk(substrate)-source at time = 0 (V). | |
| Initial G-S Voltage | Voltage across the gate-source at time = 0 (V). | |
| Initial D-S Voltage | Voltage across the drain-source at time = 0 (V). | |
| Length | The channel length (m). | |
| NRD | Equivalent number of squares of the drain diffusion. Default = 1. | |
| NRS | Equivalent number of squares of the source diffusion. Default = 1. | |
| AS | Source Area | Area of the source diffusion (m2). |
| Source Perimeter | ||
| Starting Condition | ||
| Temperature | Temperature that MOSFET is operating at. Defaults the value set to TEMP in the SPICE options page. | |
| W | Width | The channel width (m). |
Note that some manufactures choose to provide a sub-circuit model instead of using this built-in MOSFET model. This gives them the ability to better characterise the MOSFET, but there have been complaints of MOSFET sub-circuits having a big performance hit when it comes to simulation time.
Showing The Frequency Response
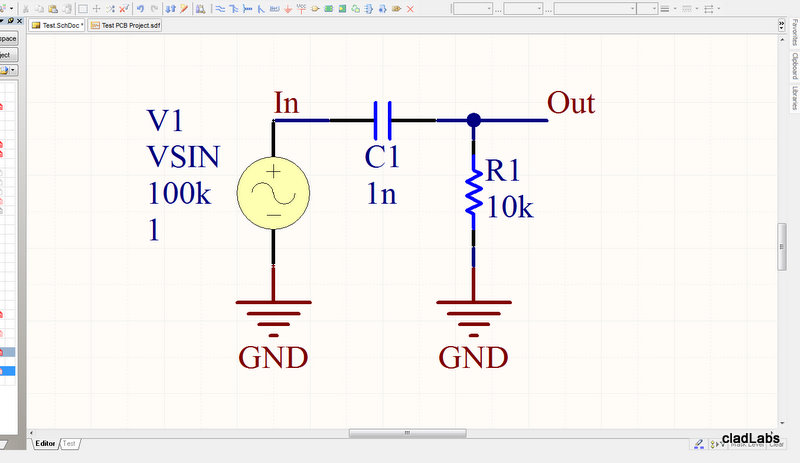
Finding the frequency response of a circuit can give you plenty of useful information. Normally a single output/single input response is found (i.e. the response at a node while changing only one other node). A frequency response is usually plotted with frequency (either with a linear scale or more commonly log) on the horizontal axis and magnitude (again, either on a linear or log scale) on the vertical scale. The following tutorial will use the following circuit, a simple first-order high-pass filter with a cut-off of 15.9kHz.
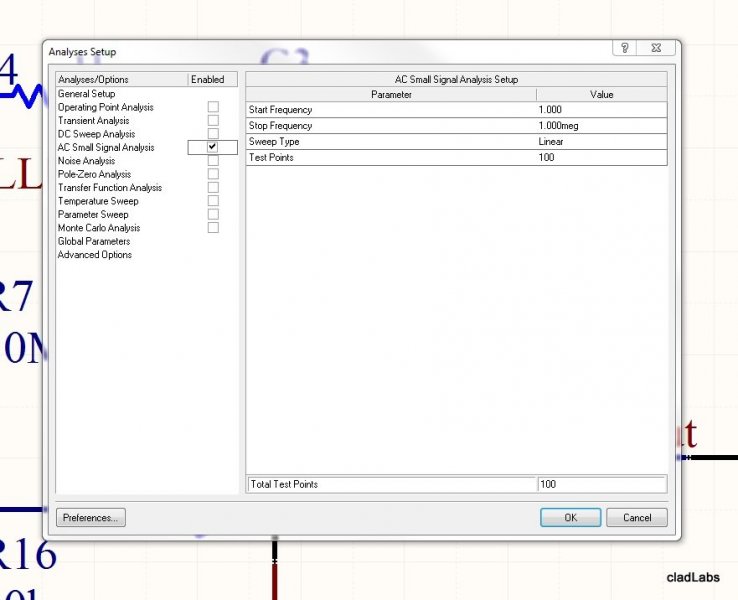
The frequency response can be found using the AC Small Signal Analysis feature of SPICE. It can be selected from the ‘Analysis Menu in Altium (Design -> Simulate -> Mixed Sim). There are not too many parameters to set, just the start and stop frequency, the sweep type and number of test points. Wait, you ask, don’t I have to choose what the input and output are? It is a little misleading, but you do this by modifying the graphing options once the simulation has run.
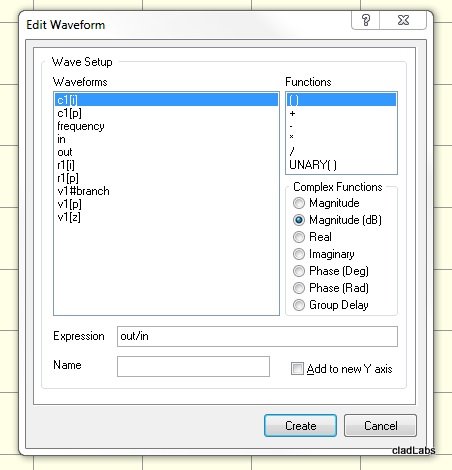
Once the simulation has run, make sure that the ‘AC Analysis’ tab is selected. Then right click and select ‘Add Wave To Plot’. The next step is the magic trick, where you actually tell Altium you want to see a frequency response. Select the output trace first from the list on the left, then click the ‘/’ in the functions box before finally selecting the input trace. This tells Altium to compare (essentially divide) the output to the input. This is how frequency responses are defined (a la Transfer Functions, but we don’t need to go into that). Select either ‘Magnitude’ or ‘Magnitude (dB)’ from the ‘Complex Functions’ list before clicking ‘Create’.
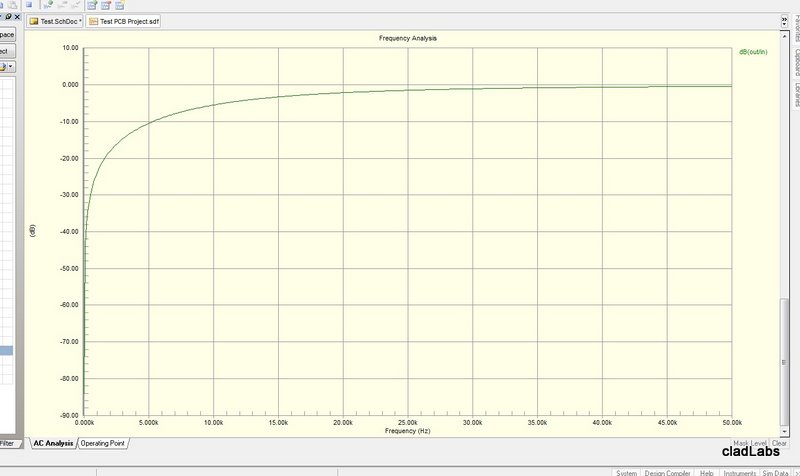
All things going well, you should now have a graph of the frequency response! The following graph shows the result I got from doing a frequency response analysis on the first-order high pass filter circuit shown above, plotted in dB. Notice it attenuates low frequencies (<0dB), and lets through high frequencies relatively untouched (a gain of 0dB). The cut-off frequency of the circuit is 15.9kHz.
Altium Simulation Bugs
I have experienced a weird bug with Altium 08, in where Altium would lose track of one of the ‘pin to model’ links that you assign in the port map window, making simulation impossible. Did not find a fix for it, so had to get rid of component from simulation entirely.
I have found another bug in Altium 15 (2015-06-12), in where Altium will fail to include a vault-based component (with simulation model), until one of the parameters in the simulation model for that component has been modified (even if it’s set back to what it originally was!).
Authors


This work is licensed under a Creative Commons Attribution 4.0 International License .
Related Content:
- Drawing Schematics With TikZ And CircuitikZ
- Altium Tricks And Standards
- Importing Altium Projects Into KiCAD
- PCB Design Tools
- PID Tuner Tool Released In NinjaCalc